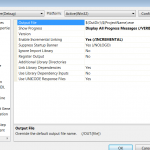

我在调试的时候选择的是
msvcmon -tcpip -anyuser


选择pipe没有成功,主动调试端总是连不上被动调试端(也就是通常所说的host)

如果没有anyuser这一选项也是不行的。
Setting Up Remote Debugging
Visual Studio .NET 2003
Visual Studio provides three ways to do remote debugging:
- The preferred method uses DCOM and the Machine Debug Manager. For more information, see Remote Debugging with DCOM and the Machine Debug Manager
. - The
other two methods are available for native C or C++ applications only.
These methods use the Remote Debug Monitor (Msvcmon) and either Pipes or
TCP/IP. For more information, see Remote Debugging with the Remote Debug Monitor
.Note
To remote debug to or from Windows XP Home Edition, you must use TCP/IP only.
After
setting up remote debugging using DCOM, you may need to grant
permission to the debugger user by adding the user to the Debugger Users
group or by configuring DCOM. When you install the remote debug
components, setup automatically adds you (the installing user) to the
Debugger Users group on that machine. If you need to add another user,
see Adding Debugger Users and Configuring DCOM
.
For a complete list of required permissions, see Required Permissions for Remote Debugging
.
Note
Remote debugging setup installs SQL Debugging Components for SQL Server. For more information, see SQL Debugging Components
.
Note
Remote debugging of ASP requires IIS to be installed on both the client and the remote machine.
Remote Debugging with DCOM and the Machine Debug Manager
For
remote debugging using DCOM, the Machine Debug Manager (MDM.exe) must
be installed and running on the remote machine. MDM.exe runs as a
service, which can be configured using the Services control panel.
There are three ways to set up DCOM remote debugging.
- You can install a full, licensed version of Visual Studio .NET on the remote machine.
- You
can run the Visual Studio Setup CD-ROM on the remote machine and choose
Remote Components Setup in the setup wizard. This will install only the
remote debugging components. After selecting Remote Components Setup,
you will have two options.Native Remote Debugging installs components that enable a debugger to connect for debugging of native code only.
Full Remote Debugging installs components that enable a debugger
to connect for debugging of native code, managed code running on the
common language runtime, and script (VBScript or JScript). If SQL Server
is installed on the machine, components for SQL remote debugging will
be installed as well.For more information, see Remote Components Setup
. - You can manually install a minimal set of required components for native remote debugging. These files are:
natdbgdm.dllpsapi.dll
(Windows NT 4.0 only)For dump support (for more information, see Dumps
), install this file as well:dbghelp.dll
(supports dumps)You can copy all these files to the same location on the remote
server, or you can run them from a share on the local machine where you
are running Visual Studio .NET. Using a share allows you to debug an
application running on a remote machine where you cannot install files.
The Machine Debug Manager Registration
If
you install Windows NT Option Pack 4.0, the Machine Debug Manager
disappears from the registry. The next time that you try remote
debugging with Visual Studio .NET, you will get a dialog box asking you
to register MDM. For more information, see MDM Registration Disappears After Installing Windows NT Option Pack 4.0
.
Remote Debugging with the Remote Debug Monitor
Note
Remote debugging with the Remote Debug Monitor is available for remote debugging of native C or C++ applications only.
For
remote debugging using Pipes or TCP/IP, you must install the Remote
Debug Monitor and run it on the remote machine. The Remote Debug Monitor
(Msvcmon.exe) is a small console application that communicates with the
debugger host and controls the execution of the program that you are
debugging. In addition, the Remote Debug Monitor requires certain
support files. For more information, see Remote Components Setup
.
Caution
TCP/IP
debugging allows you to debug an application on a remote machine that
does not have DCOM installed, but it provides less security than DCOM
debugging, so be careful. If an unauthorized user connects to your
machine through Msvcmon, he or she can penetrate the machine’s security.
Pipe debugging is more secure than TCP/IP, but it is significantly
slower, so you may want to use TCP/IP if network speed is an issue.
The
Remote Debug Monitor (Msvcmon) executable is installed in the Microsoft
Visual Studio .NET 2003/Common7/Packages/Debugger directory. You can
launch the Remote Debug Monitor from the Windows Start menu or from the
command prompt. The command to start the Remote Debug Monitor is:
By default, the msvcmon
command starts the Remote Debug Monitor in Pipe mode. If you want to
debug in TCP/IP mode instead, the Remote Debug Monitor must be started
with the -tcpip
option:
You can register the Remote Debug Monitor so that it can started automatically by the Visual Studio .NET debugger:
When debugging with Pipes, you can use the –s
and –u
options.
The –s
option specifies a suffix that will be appended to the main pipe name during debugging:
You may need to use the –s
option if you are debugging an application running on a terminal server
and another user is debugging on that machine at the same time you are.
In that event, the first debugger user to connect gets access to the
pipe name and the next user must specify a suffix to create a unique
pipe name.
The –u
option specifies a user who is allowed to connect and the domain the user is connecting from:
When debugging with TCP/IP, you can use the –anyuser
option, –maxsessions
, and –timeout
options.
The –anyuser
option allows any user to connect through Msvcmon using TCP/IP to debug applications:
Note
The–anyuser
option allows anyone who has network access to connect to the machine
for remote debugging, which could pose a serious security risk.
The –maxsessions
option allows you to change the maximum number of concurrent TCP/IP
debugging sessions allowed by Msvcmon. For example, to change the
maximum number of concurrent sessions to six, you would use:
When Msvcmon attempts to establish a
TCP/IP connection, it uses a timeout value to determine how long it will
wait for the connection before terminating the attempt. By default,
this value is 900 seconds (15 minutes). You can change the timeout value
using the–timeout
option and a value that
represents the time in seconds. For example, to change the timeout value
to 120 seconds (two minutes), you would use:
If you run Msvcmon with a value of -1
, the connection attempt will never time out:
There are two additional options that can be used for either Pipe or TCP/IP debugging. These are the -nowowwarn
and -?
Options.
The -nowowwarn
option suppresses a warning that normally occurs when mscmon is run under the WOW64 emulator:
The -?
option lists all available Msvcmon options:
Note
The
Remote Debug Monitor (Msvcmon) is required for remote debugging of
native applications under DCOM as well as TCP/IP. Remote debugging under
DCOM launches msvcmon automatically.
Required Permissions for Remote Debugging
This
section lists the minimum permissions required for remote debugging. If
you own a process, you can debug it without further permissions.
Unmanaged Code (C++)
To
debug another user’s process, you must be an Administrator on the
machine where the process runs. As an Administrator, you can connect to
the Machine Debug Monitor. In addition, Administrators have
SE_DEBUG_PRIVILEGE at the operating system level by default.
To debug your own process, you must be an administrator or be listed in the Debugger Users
group.
Caution
Adding users to the Debugger Users
group may create a security risk by allowing those users to access the
machine. You should add only those users that need debugger access on
that particular machine. Do not add Everyone
to the Debugger Users
group.
Managed Code (Managed Extensions for C++, C#, Visual Basic, JScript .NET)
To
debug another user’s process, you must be an administrator on the
machine where the process runs. For example, if aspnet_wp.exe is running
as SYSTEM or ASPNET, you need to be an administrator to debug it.
To debug your own process, you must be an administrator or be listed in the Debugger Users
group.
Caution
Adding users to the Debugger Users
group may create a security risk by allowing those users to access the
machine. You should add only those users that need debugger access on
that particular machine. Do not add Everyone
to the Debugger Users
group.
T-SQL
You must have permission to execute sp_sdidebug()
on the database.
You must have mssdi98.dll
installed in the Binn
directory of your SQL Server installation.
On operating systems before Windows XP, SQL Server must not be running as Local System.
See Also
Remote Debugging Errors
| Remote Debugging Setup
| Adding Debugger Users and Configuring DCOM
| Just-In-Time Debugging
版权所有,禁止转载. 如需转载,请先征得博主的同意,并且表明文章出处,否则按侵权处理.